

 +852 2866 8995
 General Enquiry: cs@medikonia.com | Support: support@medikonia.com


Yokogawa Software
With powerful machine learning functions, our analysis software suite supports drug discovery and provides researchers with advanced insights into high content analysis (HCA) experiments such as label-free cell imaging, 3D image analysis, and texture analysis. Equipped with label-free image analysis technology and digital phase contrast (DPC) technology, our analysis software extracts valuable data from images more efficiently and enables objective, quantitative assessments.
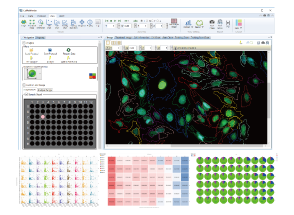
The intuitive, easy-to-use interface guides the user from analyzing thousands of image data in various angles to visualize the result by generating numerous graph types.
In addition, the Machine Learning and Deep Learning function increase the target recognition capability dramatically. It is also ideal for the analysis with the complexity and high-degree-of-difficulty such as analyzing the data from 3D culture and live-cell imaging.
The CellPathfinder software is a powerful tool for HCA.
You can download trial software. Software download
CellPathfinder resolves screening bottlenecks.
CellPathfinder provides leading HCA through proprietary analysis technology.


・Easy to compare images between wells

・Easy-to-understand graphical icons
・Choose a preset template for your analysis

・Specific populations can be extracted by gating the feature value data of recognized objects
・The extracted populations can be analyzed further

・Various graph options to visualize the results
・The link between graph and images enables quick visual check of images by clicking data points

・Images and numerical data can be collected by clicking cells
・Analysis of Z-stack images in three-dimensional space. ・The volume and the location of objects in 3D space can be quantified.

Tiled images are generated through image stitching and analyzed, allowing for accurate quantification.
Ideal for analysis spanning across fields, such as of spheroids, tissue sections and neurites.

NEW!
Support for downsampling
When spatial resolution is not required, fast analysis is possible.
It also makes it easier than ever to handle huge tiled images.

Manual region of analysis regions is possible for complex trends that are difficult to identify through automated image processing.
Morphology in the defined regions can be visualized, facilitating analysis.

Data provided by Dr. Yasuhito Shimada, Mie University Graduate School of Medicine
Analysis results can be displayed by Bar chart, Line chart, Pie chart, Scatter plot, Heatmap, and Histogram.
In addition, EC50, IC50 and Z'-Factor of the analysis results can be calculated.


The Basic Pack includes the basic functions necessary to acquire various quantitative data on the morphology and brightness of cells from fluorescence images.
In addition, by adding optional functions, a variety of analyses that are not possible with the basic pack become possible.
By using Yokogawa's "CE Bright Field" proprietary image creation technology, two types of images can be output from bright field images.
This is a powerful pre-processing function for analysis using the Deep Learning function of Bright Field images.

Phase-type: Images such as those taken by phase-contrast microscopy.
It is useful for high-precision recognition of cell contours and analysis of cell phenotypes.
Fluor-type: Fluorescence-like images, It is useful for nuclear recognition, etc.
Machine Learning functionality allows for unbiased digitization in experiments evaluated through appearence.
Furthermore, automated shape recognition can be performed by simply clicking on the shape you wish the software to learn.

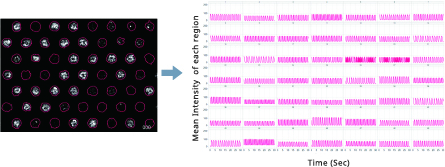
The fast calcium oscillations of cardiomyocyte and neuronal activities can be represented as waveforms by measuring intensities in the same region throughout the time-lapse.
You can monitor dynamic cell behavior by tracking indivisual cell.
It can also track daughter cells after cell division, enabling analysis of cell lineage.
![]()
Cells can be classified into groups of cells with similar characteristics.
This function enables to evaluate the number of cells and the ratio of cells in each cell group, and the feature quantities in each specific cell group.

You can recognize targeted objects, such as cells and intracellular organelles by painting them using not only fluorescence images but also bright field images.
This function is useful when the analysis accuracy with conventional analysis methods are not enough.

Original image

Recognition result
This function detects cells with simple operation of enclosing cells.
No expertise is required.
It is possible to count cells in high-density on bright field images as well as flourescence images.

Original image

Recognition result
You can classify phenotypes that are difficult to quantify but appear to be "something different".
Simple operation of selecting the cell groups to be classified.
No need to select effective features or set thresholds.
Control

6.8uM Etoposide
Ratio of cells in each cell cycle at each well.
This function enables comprehensive quantification of complex phenotypes using whole images.
Simple operation of slecting negative and positive wells and entering compound concentration information.
Any protocol to segment cells is not necessary.

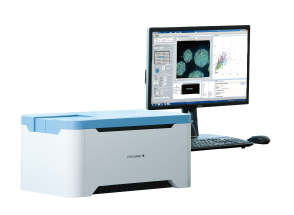
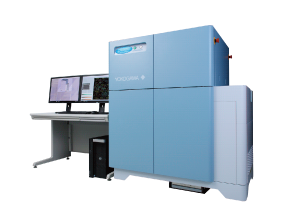
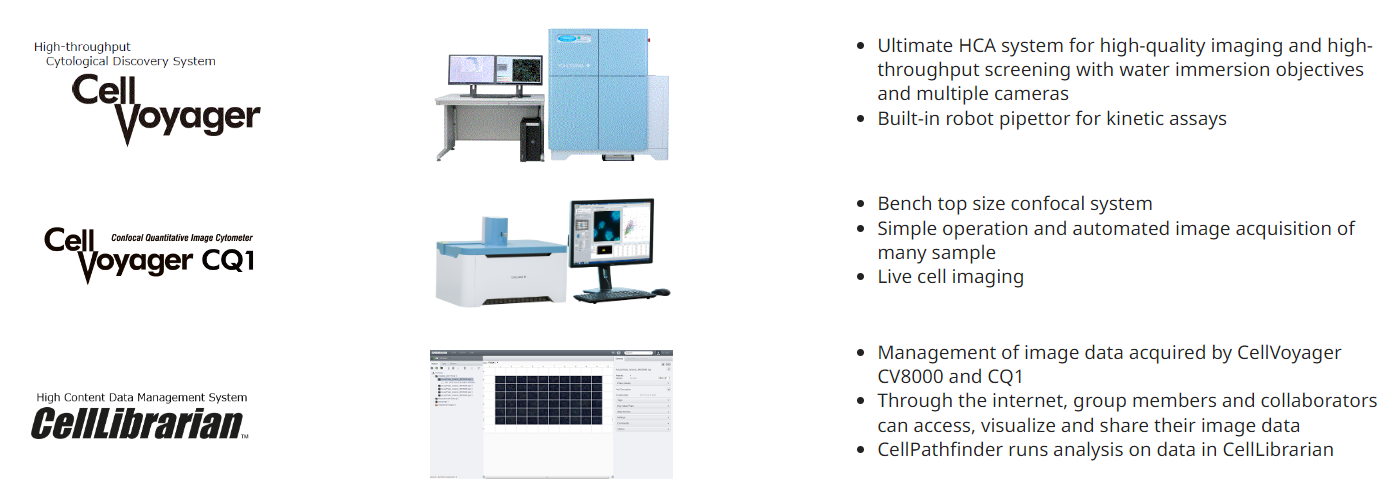
Plate transport via rebot, acquisition using CellVoyager CV8000 or CQ1, data management using CellLibrarian, and image analysis using CellPathfinder.
We offer optimum combinations matched to users' needs and budgets.

CellActivision Features
CellActivision uses Machine Learning Technology and a unique digital filter to recognise cells or colonies directly from label free images. CellActivision can also classify and quantify these cells by the use of sample libraries which are easily prepared by the user.
Why use CellActivision?
CellActivision allows population analysis of label-free live cell images.


Input images
Images captured by a cell imaging system, such as CQ1 are uploaded in to the CellActivision software for processing.
*) Please contact us for details of image file compatibility.

Make Sample library, Process Recognition and Classification
A sample library is generated by the user which contains examples of cell morphologies or cell types to be quantified. CellActivision extracts characteristics from the cells for each of these defined classes and, using the Machine Learning Technology, generates data for cell number counts, colony size or other parameter that has been requested.

Charts and Videos
Result data is automatically presented in graphical form and can easily be exported to another package such as Excel. The video of the analysed images, showing e.g. classified cells or segmented colonies, is compatible with Windows Media Player.
| Operation system | Microsoft Windows 7 or 8.1 with the latest service packs installed (64-bit editions) |
| Processor | 1.5 GHz processor (2 GHz or higher recommended. Dual- or quad-core recommended if the computer is used also for other purposes.) |
| Memory | 2 GB of RAM (3 GB or higher recommended) |
| HDD | 5 GB of free hard drive space (Minimum 350 GB HDD recommended for result saving) |
| Display | Minimum display resolution: 1024 x 768 |
| Visual C++ Redistributable for Visual Studio 2012, VSU_4¥vcredist_x64.exe, is required to be installed. This is provided by Microsoft: https://www.microsoft.com/en-us/download/details.aspx?id=30679  |
|
There are two kinds of CellActivision software.
Please download as usage.
| Free 30 days trial version | Download |
|---|---|
| Lisenced version | Download |
To use CellActivision, the activation code is required.
After unzipping a zip file and installing the software, Site code and MID will be displayed. Fill in the request sheet and send to us by e-mail.
For more information or ordering the products, please email us at cs@medikonia.com.
General Enquiry: cs@medikonia.com | Support: support@medikonia.com
+852 2866 8995
Unit 1005-1006, 10/F, Tower I, Grand Century Place, 193 Prince Edward Road West, Mong Kok, Kowloon, Hong Kong


Powered by Medikonia Limited 2023